🎉 Gate Square Growth Points Summer Lucky Draw Round 1️⃣ 2️⃣ Is Live!
🎁 Prize pool over $10,000! Win Huawei Mate Tri-fold Phone, F1 Red Bull Racing Car Model, exclusive Gate merch, popular tokens & more!
Try your luck now 👉 https://www.gate.com/activities/pointprize?now_period=12
How to earn Growth Points fast?
1️⃣ Go to [Square], tap the icon next to your avatar to enter [Community Center]
2️⃣ Complete daily tasks like posting, commenting, liking, and chatting to earn points
100% chance to win — prizes guaranteed! Come and draw now!
Event ends: August 9, 16:00 UTC
More details: https://www

[Foreign Exchange] As expected, the ruling party fell short of a majority in the Upper House elections, and the Dollar/Yen experienced volatile price movements | This Week's Foreign Exchange Market Forecast (Technical Analysis) | Moneyクリ Monex Securities' investment information and media useful for managing money.
Current Fundamentals: In the short-term, there is a movement to buy US Dollars due to the rise in US Interest Rates.
The range and closing price for last week (week of July 14) (Bid rate of MoneyX Trader FX)
・Dollar/Yen: 146.851 yen – 149.181 yen 148.834 yen
・Euro/USD: 1.15564 Dollar~1.17213 Dollar 1.16225 Dollar
・Euro/Yen: 171.693 Yen ~ 173.242 Yen 172.994 Yen
Last week (week of July 14), the Dollar/Yen: the lowest Yen level since June 23.
Last week (the week of July 14), in the first half of the week, the rise of the Dollar/Yen reacted to U.S. inflation-related indicators, while there was a decline due to the turmoil surrounding the dismissal of Fed Chairman Powell. In the second half of the week, movements to sell the yen, mainly by overseas investors, were prominent due to speculation about the ruling party losing its majority ahead of the House of Councillors election.
The US June CPI announced on July 15 was almost as expected, and although there was an initial reaction of selling the Dollar right after the announcement, the Interest Rate in the US has been rising steadily since the bottoming out with the April CPI released in May, leading to an increase in the Dollar/Yen, which moved to the 149 Yen level.
On the morning of July 16 in Tokyo, the yield on the US 10-year bond rose to 4.495%, and the Dollar/Yen also reached 149.181 yen by early afternoon in Tokyo, marking the highest level since April 3. However, in the NY market, the US PPI was lower than expected, leading to a decline in US interest rates. As the Dollar/Yen adjusted to this peak around 149 yen, news surfaced that President Trump had inquired with Republican lawmakers about dismissing Fed Chairman Powell, causing the Dollar/Yen to plummet. It hit a weekly low of 146.851 yen. Subsequently, after President Trump stated that there were "no plans to dismiss the chairman," the value quickly rebounded, and on July 17, it attempted to reach the 149 yen level again.
The strong performance of the Nikkei average and the view that the ruling party would fall short of a majority in the House of Councillors election on July 20 led to increased selling of the yen. However, personally, I feel that the heaviness of the upper range in the 149 yen level left a stronger impression. The House of Councillors election resulted in the ruling party falling short of a majority, as predicted, and in the early morning market on July 21, there were also yen buybacks for profit-taking. However, due to the Tokyo market being closed, the price movement was quite volatile.
Euro/USD for the week of July 14: Entering a consolidation phase after hitting a new high.
Last week (the week of July 14), the Euro/USD started off with a heavy upper limit due to President Trump announcing a new 30% tariff rate on the EU at the end of the previous week (the week of July 7). Following the US CPI, there was a movement to buy the Dollar, and on the next day (July 16), until the Powell dismissal uproar, the Euro had dropped to the late 1.15 Dollar range. However, due to the Dollar selling movement from the Powell dismissal uproar, it showed a sharp rebound to a weekly high of 1.17213 Dollars.
However, after that, it rapidly declined in value, similar to the Dollar/Yen, reaching a weekly low of 1.15564 dollars on July 17. On July 18, it had rebounded to the high 1.16 dollar range, but in response to President Trump's statement that "tariffs on the EU will be at least 15-20%", it pushed down to the low 1.16 dollar range, ending the week.
The euro/yen continued its upward trend in the first half of the week, reaching a high of 173.242 yen, but dropped below 172 yen due to the Powell dismissal uproar. However, it was unable to test the week's initial low, and thereafter, buying activity strengthened again, closing near 173 yen.
USD/JPY Chart (Weekly), Moving Average Line Breakout Confirmed for 2 Consecutive Weeks
We will make long-term judgments based on the weekly chart, so please first take a look at the weekly chart.
[Figure 1] USD/JPY (Weekly)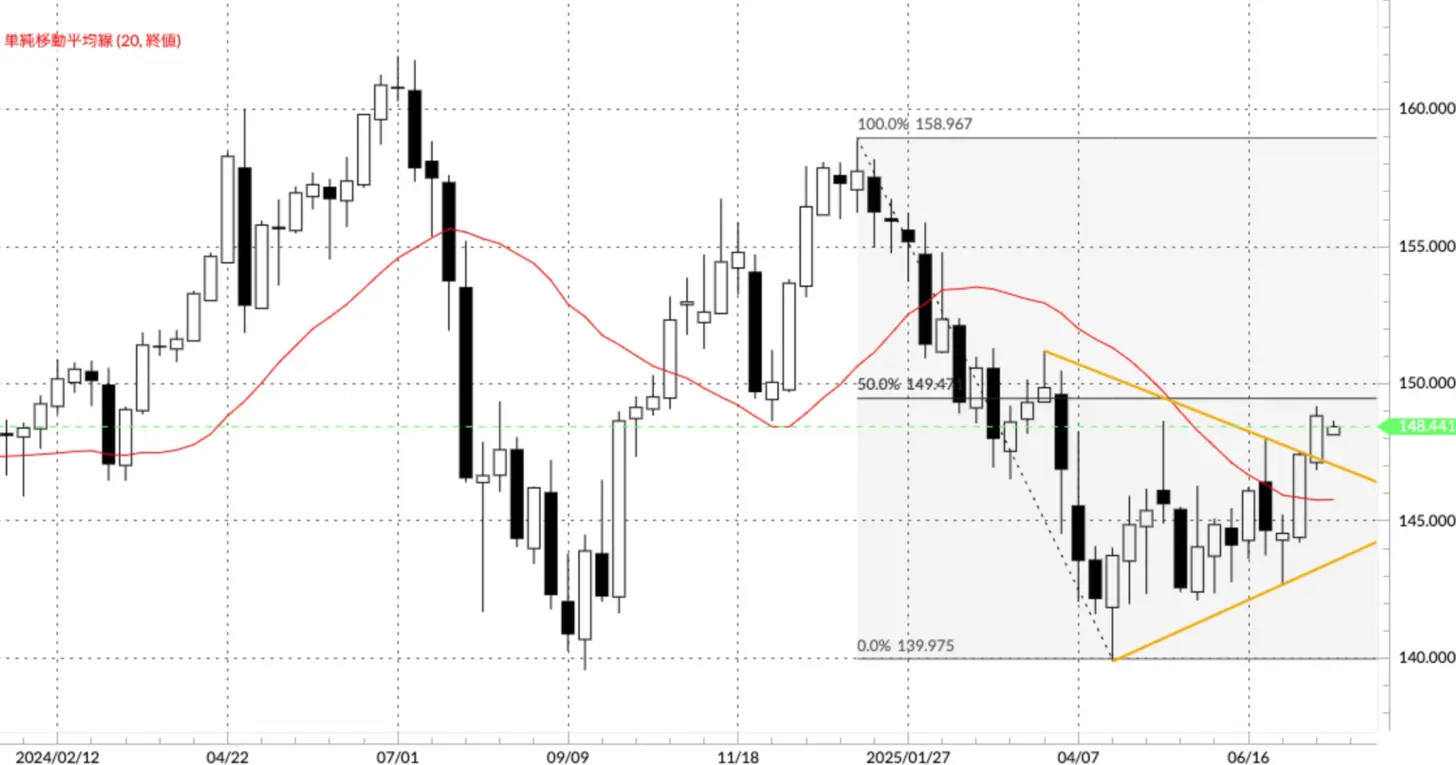 Source: Money Expert Trader FX
[How to Read Weekly Charts] The long-term trend is determined by the relationship between the 20-week moving average and the weekly closing price.
Source: Money Expert Trader FX
[How to Read Weekly Charts] The long-term trend is determined by the relationship between the 20-week moving average and the weekly closing price.
・Rise trend = Weekly closing price is above the moving average line
・Downtrend = Weekly closing price is below the moving average line
To determine a trend reversal and eliminate false signals, we consider that a trend has reversed when the moving average is exceeded for two consecutive weeks, either above or below. In the weekly chart, following last week's close above the 20-week moving average (red), the close on July 18 also exceeded the 20-week moving average (see Chart 1). This means that since the moving average was exceeded for two consecutive weeks, we judge that there has been a long-term shift to a strong Dollar and weak Yen trend. The clear breakout above the triangle (yellow) also reinforces the trend of a strong Dollar and weak Yen.
Please take a look at the daily chart.
Dollar/Yen Chart (Daily), Waiting for the Occurrence of a New Golden Cross
Short-term decisions are made based on the daily chart.
[Figure 2] USD/JPY (Daily)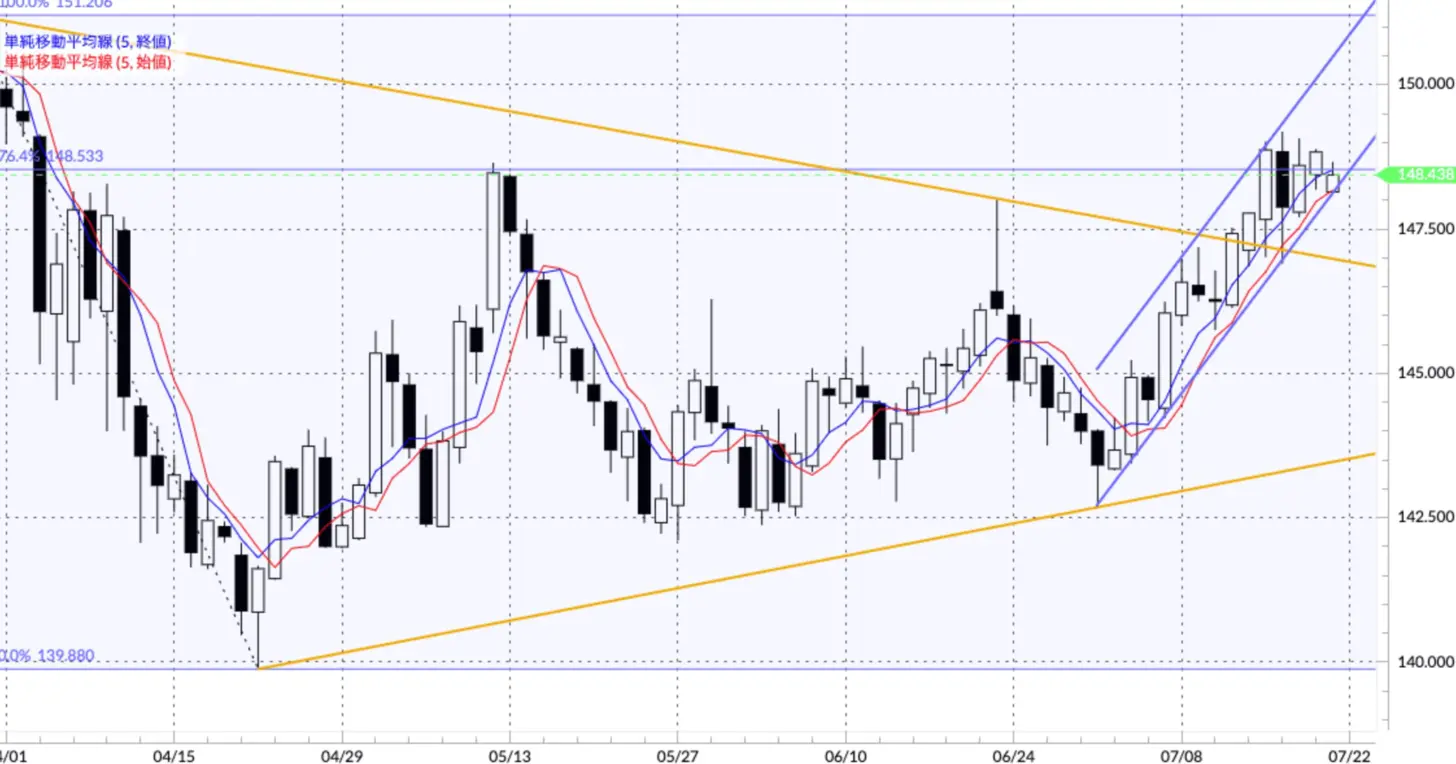 Source: Money Exchange Trader FX
【How to Read Daily Charts】 Short-term trading signals are determined by the golden cross (GC) and dead cross (DC) of the 5-day closing price moving average (blue) and the 5-day opening price moving average (red).
Source: Money Exchange Trader FX
【How to Read Daily Charts】 Short-term trading signals are determined by the golden cross (GC) and dead cross (DC) of the 5-day closing price moving average (blue) and the 5-day opening price moving average (red).
・Buy Signal = The closing price moving average crosses the opening price moving average from below to above GC
・Sell Signal = When the closing price moving average crosses the opening price moving average from above, during a DC short-term rising trend, the closing price moving average stays above the opening price moving average, and during a short-term declining trend, the closing price moving average stays below the opening price moving average. It is easy to understand if we consider that the closing price acts as the short-term line and the opening price acts as the long-term line, in terms of the two normal moving averages. *In Moneyx Trader FX, you can select the opening price in the moving average settings screen. There are two rising trends for USD/JPY with the moving average line and triangle, and the golden cross condition lit up on July 3rd continues on the daily chart. Although it is somewhat narrow and at a steep angle, there have been examples of a long-lasting rising trend with EUR/JPY, so I also drew a parallel rising channel (blue).
Currently, the resistance around the 149 yen level feels heavy, and since we are close to the lower limit of this parallel channel, it would be prudent to wait for the next death cross before anticipating the emergence of a new golden cross. However, as mentioned above, there is the case of the Euro/Yen, so it seems advisable to refrain from selling based on value perception.
Euro/USD continues the buying trend, possibly moving within a rising wedge.
Let's take a look at the Euro/US Dollar chart.
[Figure 3] Euro/US Dollar (Weekly) Long-term Trend = Continued Euro Buying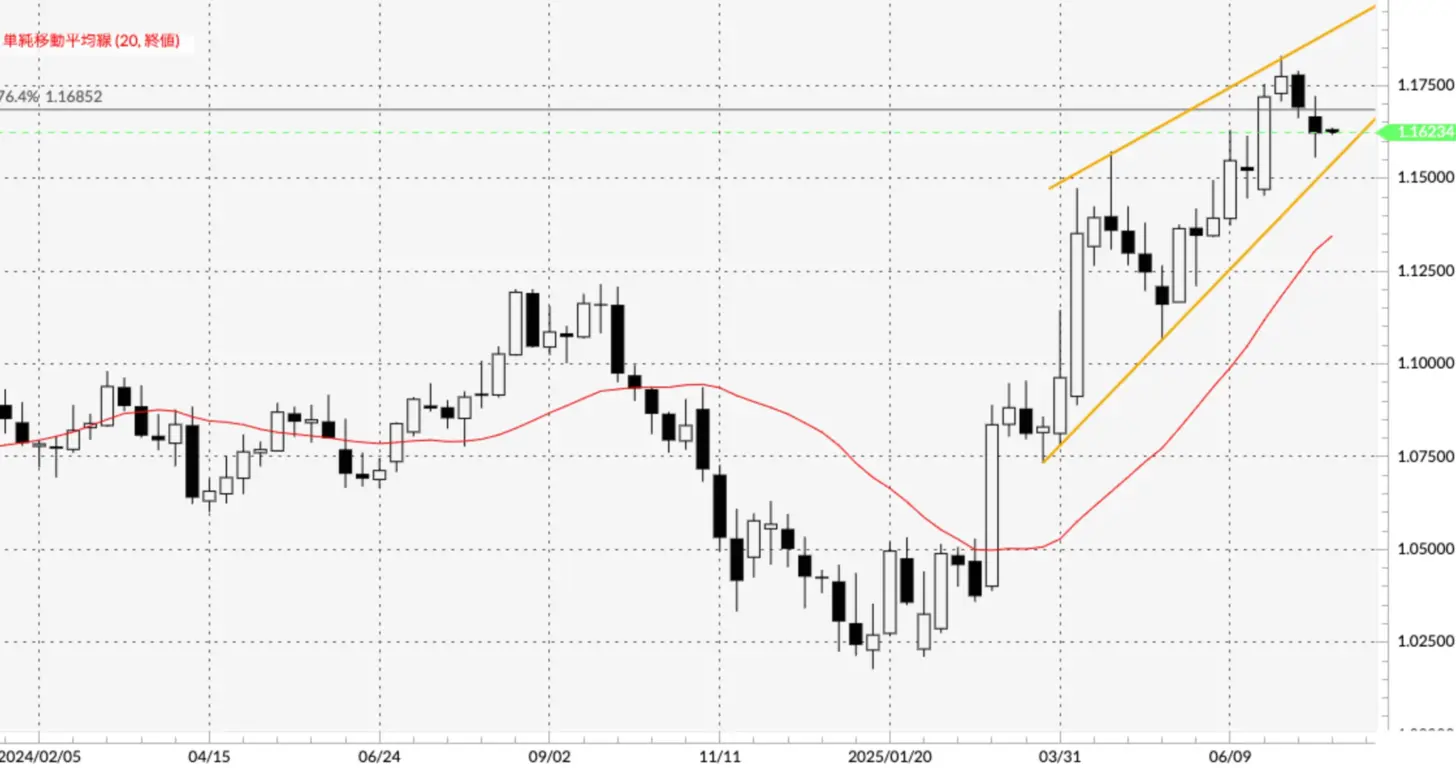 Source: Manex Trader FX
[Chart 4] Euro/US Dollar (Daily) Short-term Trend = 7-day dead cross condition continues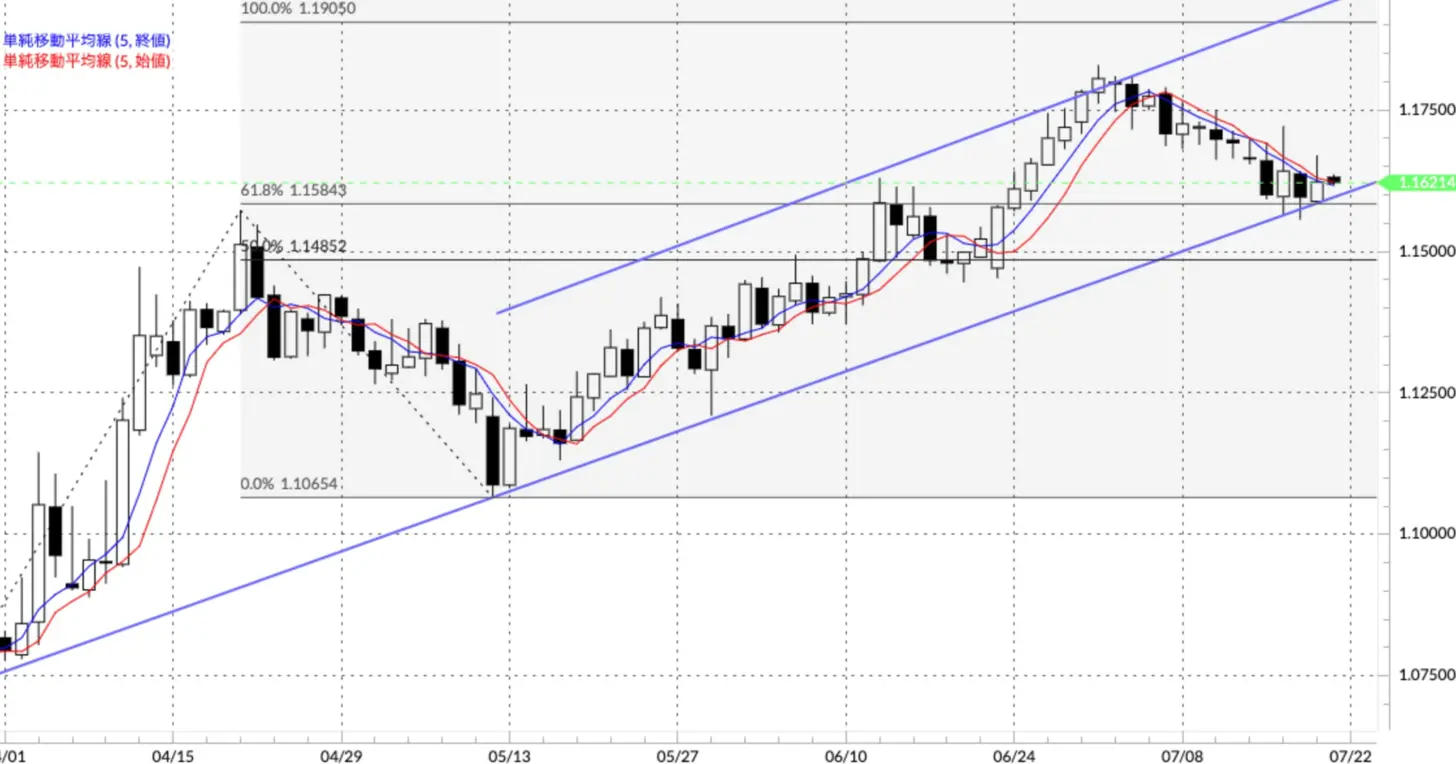 Source: Manex Trader FX
The weekly chart (Figure 3) maintains a position above the moving average line, but the adjustment phase continues. A new rising wedge (yellow) has been drawn, and it seems that this week will be one to watch whether the movements continue within this range or break down.
Source: Manex Trader FX
The weekly chart (Figure 3) maintains a position above the moving average line, but the adjustment phase continues. A new rising wedge (yellow) has been drawn, and it seems that this week will be one to watch whether the movements continue within this range or break down.
In the daily chart (Figure 4), a dead cross has been illuminated since July 7, and that trend has continued. However, as we approach the lower limit of the parallel ascending channel formed by the support line (blue) and the resistance line since late March, it remains to be seen whether it will stop declining here, which seems to depend on the tariff negotiations between the US and Europe, but technically it has become an unclear level.
Long-term trend of Euro/Yen, is the continuous buying of Euro about to see a correction?
Next is the Euro/Yen chart.
[Figure 5] Euro/Yen (Weekly) Long-term Trend = Euro Buying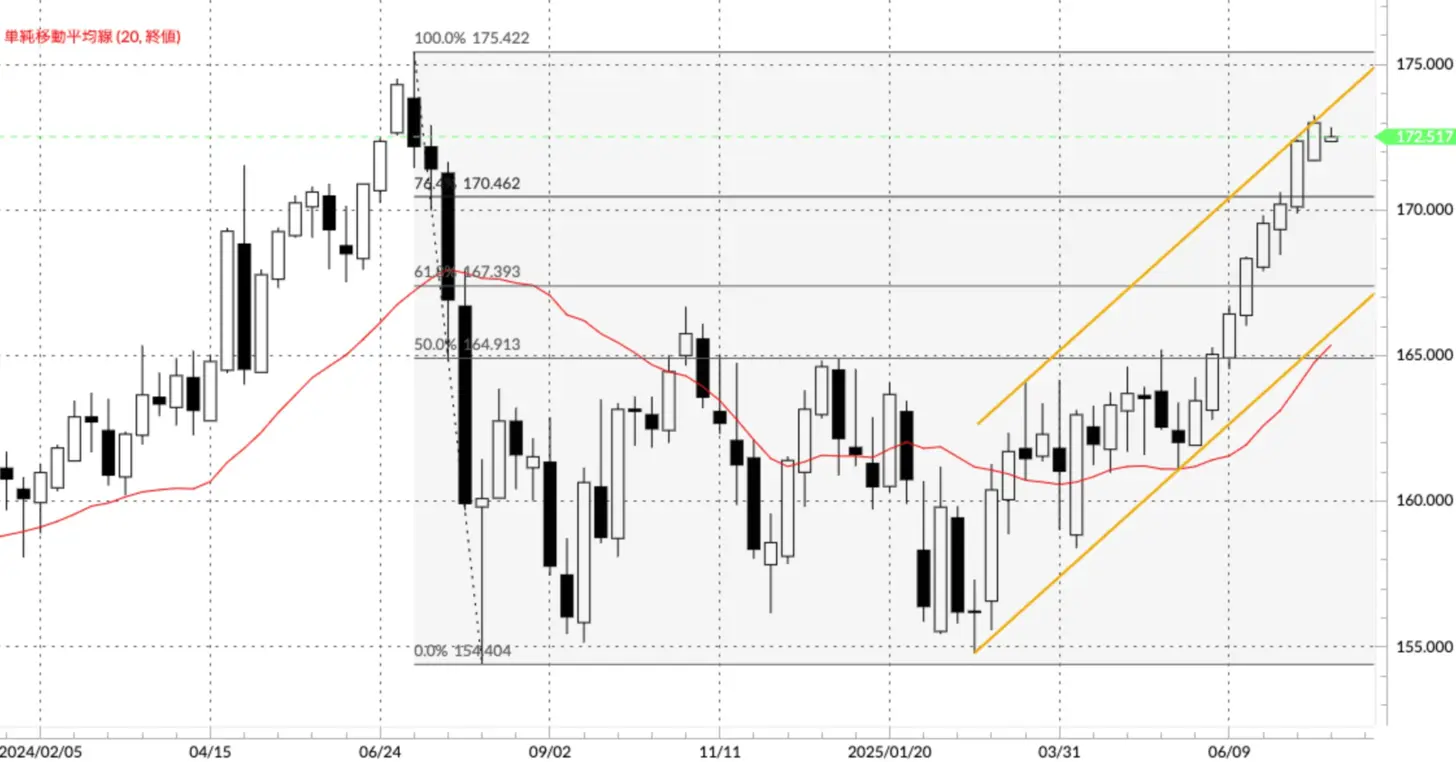 Source: MoneyX Trader FX
In the weekly chart of Euro/Yen, movement above the moving average has been long sustained within an ascending channel (yellow) formed by the support line from the year-to-date low and a parallel line drawn to it. Technically, decisions will be made after changes occur, so while remaining cautious, the current situation is that the Euro is in a strengthening trend (Figure 5).
Source: MoneyX Trader FX
In the weekly chart of Euro/Yen, movement above the moving average has been long sustained within an ascending channel (yellow) formed by the support line from the year-to-date low and a parallel line drawn to it. Technically, decisions will be made after changes occur, so while remaining cautious, the current situation is that the Euro is in a strengthening trend (Figure 5).
[Figure 6] Euro/Yen (Daily) Short-term Trend = Euro Buy (May 26 GC Ongoing)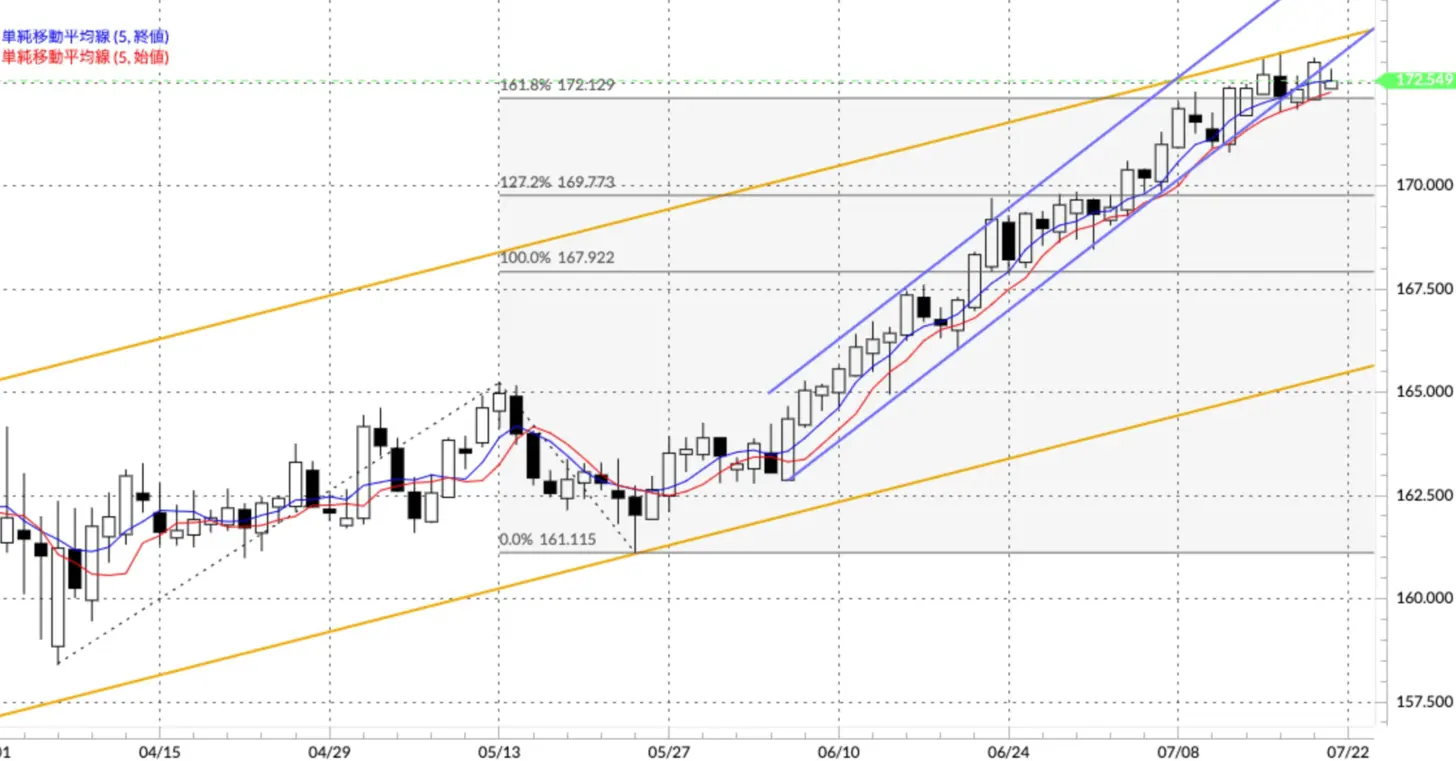 Source: Money Exchange Trader FX
In the daily chart (Figure 6), the golden cross state from May 26 continues as usual. "It wouldn't be surprising if a correction comes soon," I have been writing for about two weeks. However, last week it began to break below the rising channel, and the angle of ascent has also become gentler. We should be cautious as the next dead cross may lead to a larger trend than expected.
Source: Money Exchange Trader FX
In the daily chart (Figure 6), the golden cross state from May 26 continues as usual. "It wouldn't be surprising if a correction comes soon," I have been writing for about two weeks. However, last week it began to break below the rising channel, and the angle of ascent has also become gentler. We should be cautious as the next dead cross may lead to a larger trend than expected.
Well then, good trading this week!