- 话题1/3
33k 热度
22k 热度
40k 热度
8k 热度
21k 热度
- 置顶
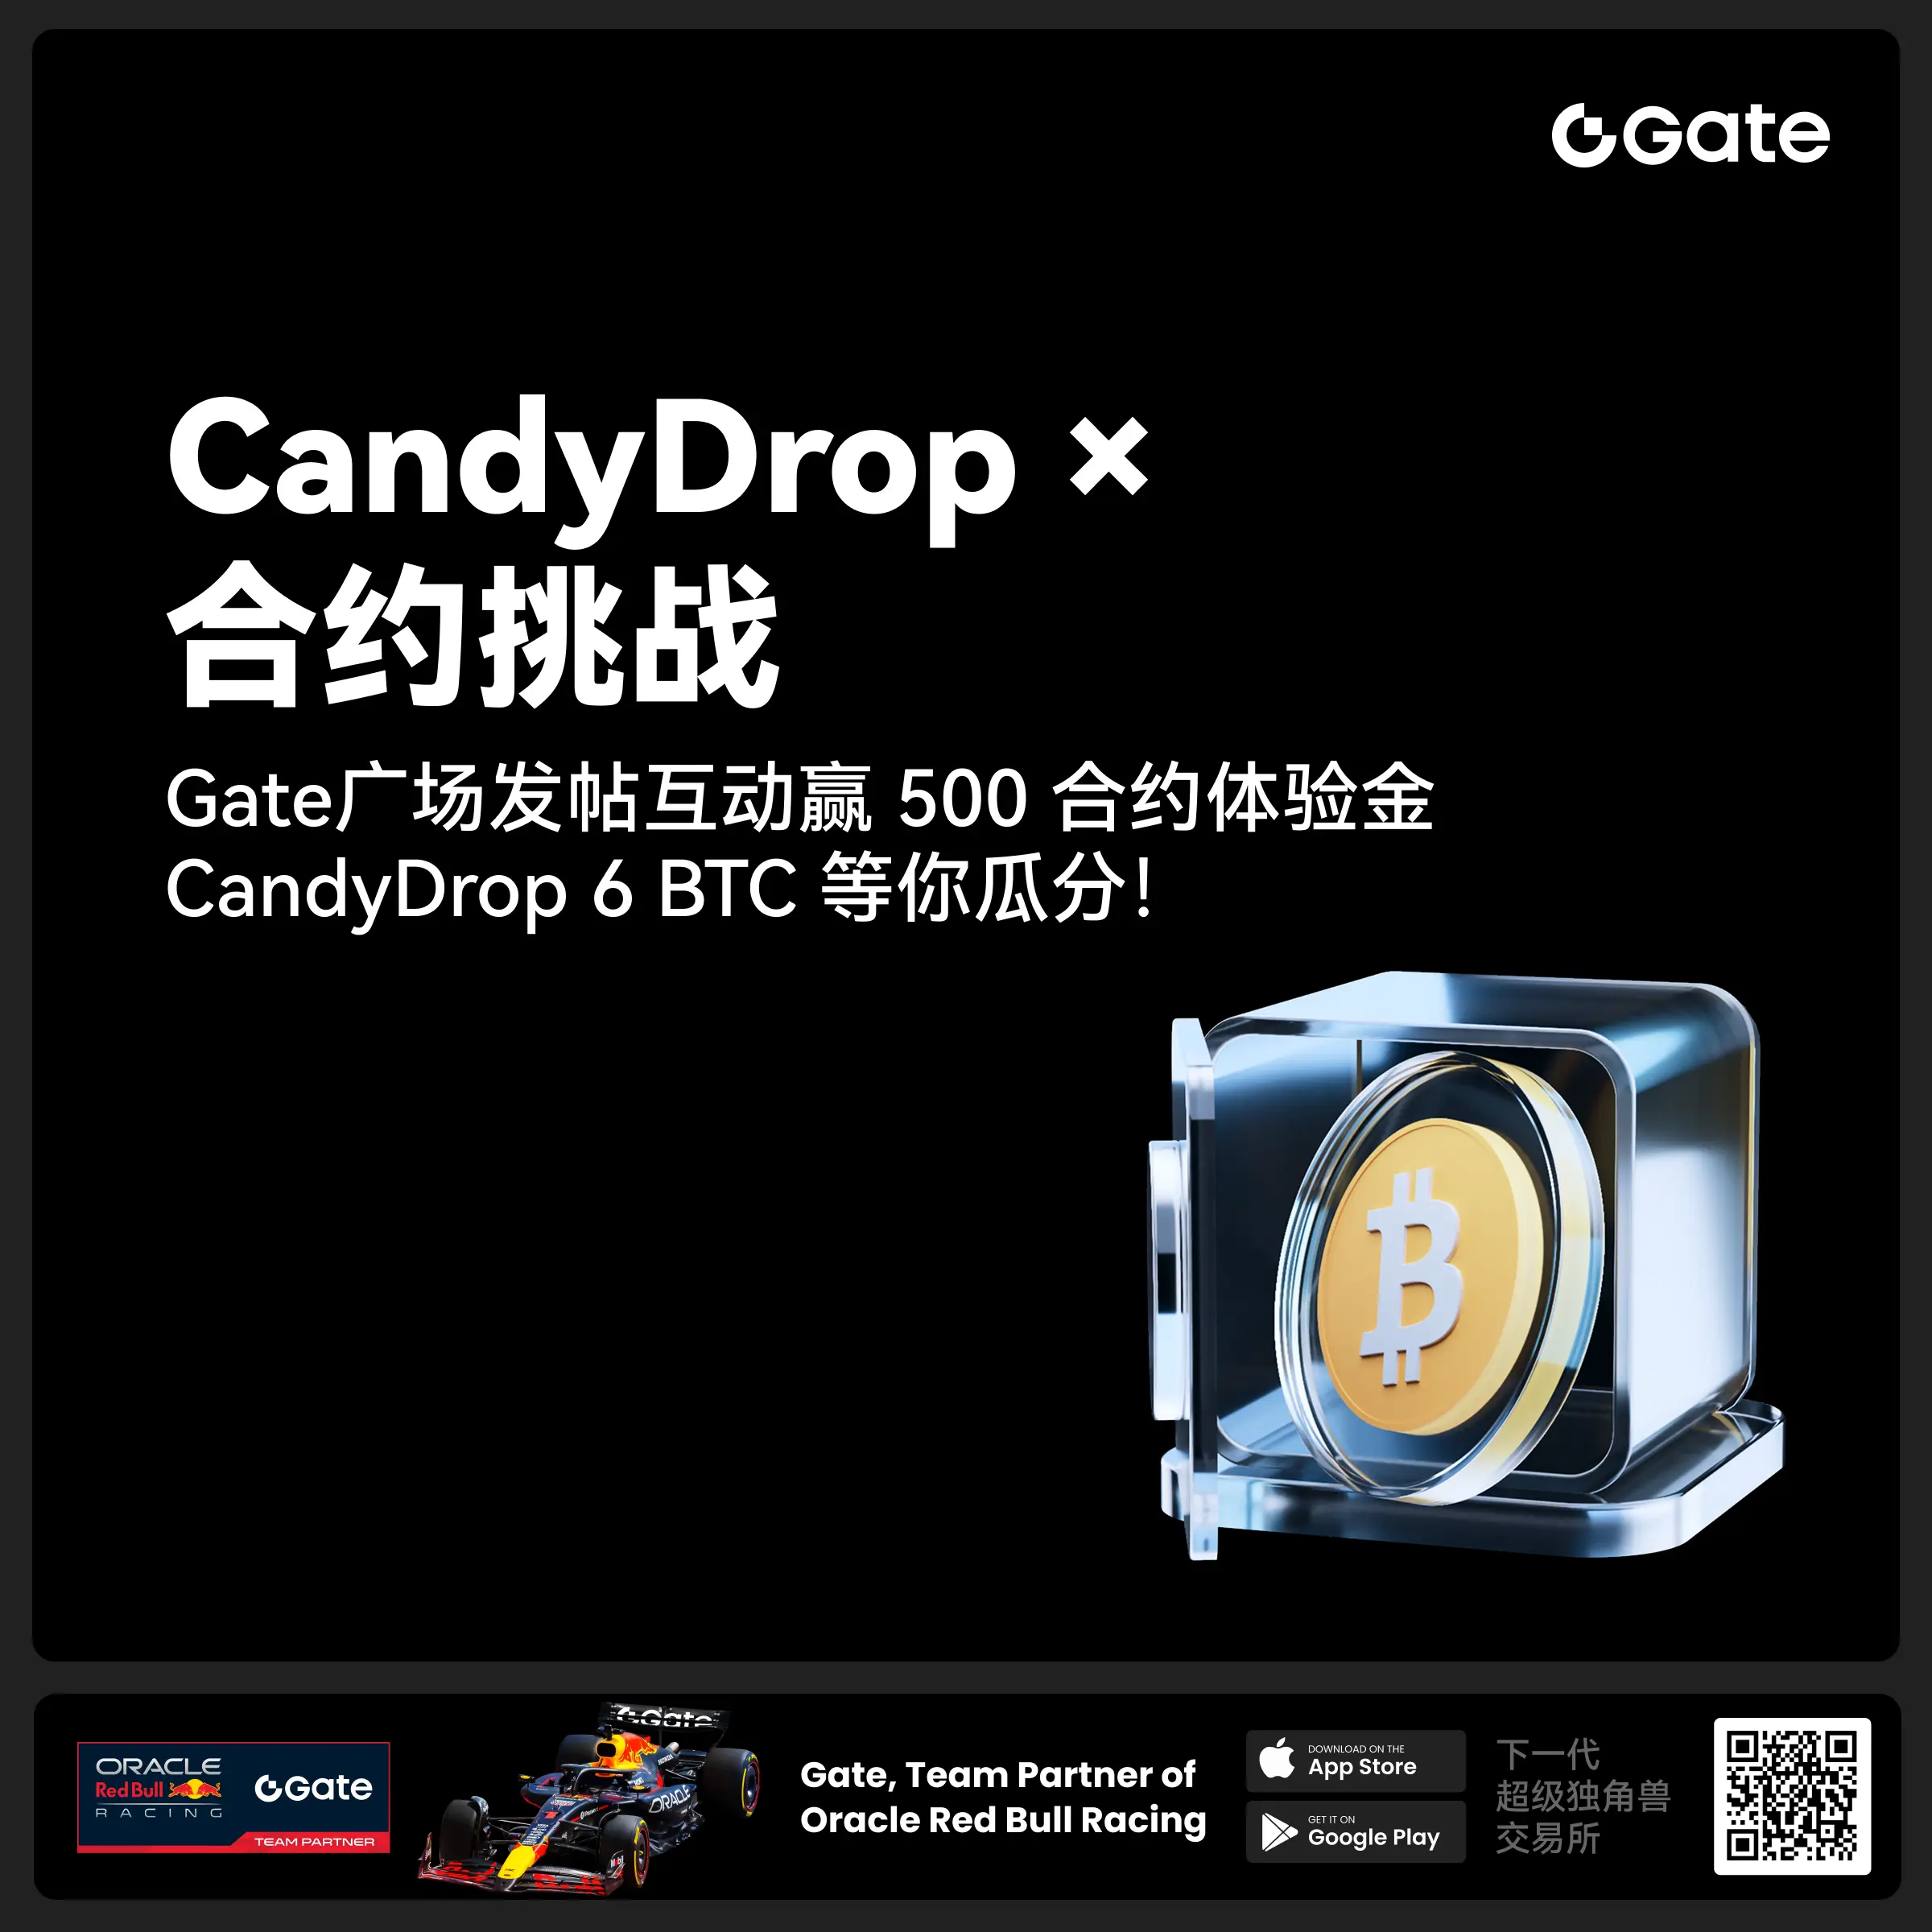
- 🎉 #CandyDrop合约挑战# 正式开启!参与即可瓜分 6 BTC 豪华奖池!
📢 在 Gate 广场带话题发布你的合约体验
🎁 优质贴文用户瓜分$500 合约体验金券,20位名额等你上榜!
📅 活动时间:2025 年 8 月 1 日 15:00 - 8 月 15 日 19:00 (UTC+8)
👉 活动链接:https://www.gate.com/candy-drop/detail/BTC-98
敢合约,敢盈利
- 🎉 攒成长值,抽华为Mate三折叠!广场第 1️⃣ 2️⃣ 期夏季成长值抽奖大狂欢开启!
总奖池超 $10,000+,华为Mate三折叠手机、F1红牛赛车模型、Gate限量周边、热门代币等你来抽!
立即抽奖 👉 https://www.gate.com/activities/pointprize?now_period=12
如何快速赚成长值?
1️⃣ 进入【广场】,点击头像旁标识进入【社区中心】
2️⃣ 完成发帖、评论、点赞、发言等日常任务,成长值拿不停
100%有奖,抽到赚到,大奖等你抱走,赶紧试试手气!
截止于 8月9日 24:00 (UTC+8)
详情: https://www.gate.com/announcements/article/46384
#成长值抽奖12期开启#
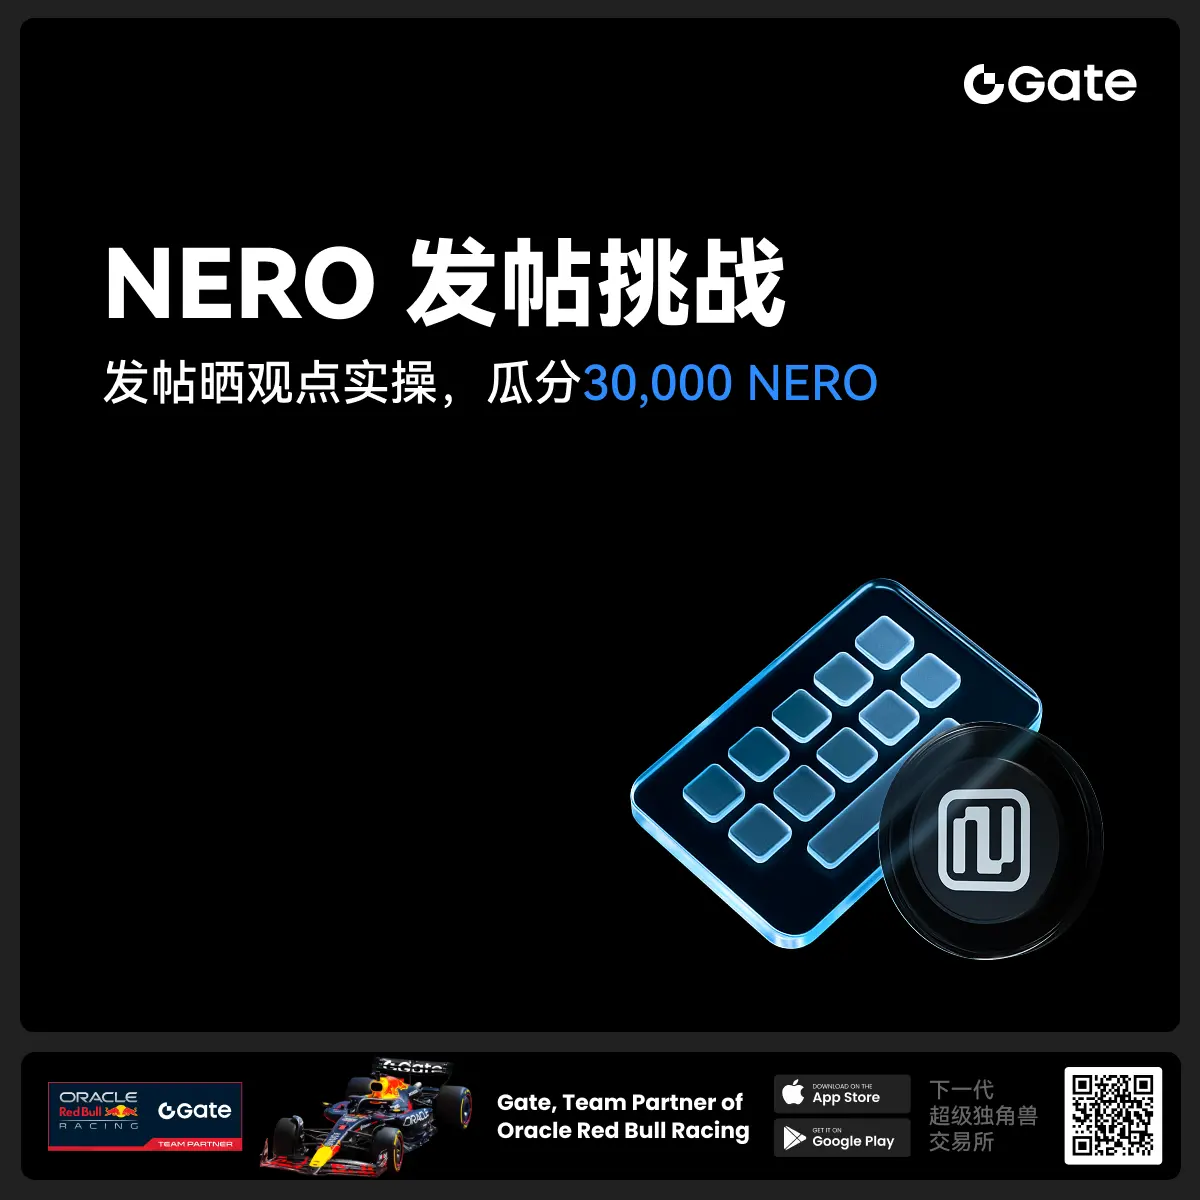
- 📢 Gate广场 #NERO发帖挑战# 秀观点赢大奖活动火热开启!
Gate NERO生态周来袭!发帖秀出NERO项目洞察和活动实用攻略,瓜分30,000NERO!
💰️ 15位优质发帖用户 * 2,000枚NERO每人
如何参与:
1️⃣ 调研NERO项目
对NERO的基本面、社区治理、发展目标、代币经济模型等方面进行研究,分享你对项目的深度研究。
2️⃣ 参与并分享真实体验
参与NERO生态周相关活动,并晒出你的参与截图、收益图或实用教程。可以是收益展示、简明易懂的新手攻略、小窍门,也可以是行情点位分析,内容详实优先。
3️⃣ 鼓励带新互动
如果你的帖子吸引到他人参与活动,或者有好友评论“已参与/已交易”,将大幅提升你的获奖概率!
NERO热门活动(帖文需附以下活动链接):
NERO Chain (NERO) 生态周:Gate 已上线 NERO 现货交易,为回馈平台用户,HODLer Airdrop、Launchpool、CandyDrop、余币宝已上线 NERO,邀您体验。参与攻略见公告:https://www.gate.com/announcements/article/46284
高质量帖子Tips:
教程越详细、图片越直观、互动量越高,获奖几率越大!
市场见解独到、真实参与经历、有带新互动者,评选将优先考虑。
帖子需原创,字数不少于250字,且需获得至少3条有效互动
- 🎉 亲爱的广场小伙伴们,福利不停,精彩不断!目前广场上这些热门发帖赢奖活动火热进行中,发帖越多,奖励越多,快来GET你的专属好礼吧!🚀
1️⃣ #GateLaunchpad上线IKA# |IKA认购体验
在Gate广场带话题晒出你的IKA Launchpad认购体验,4位幸运分享者讲瓜分$200分享奖池!
详情 👉️ https://www.gate.com/post/status/12566958
2️⃣ #ETH冲击4800# |行情分析预测
大胆发帖预测ETH走势,展示你的市场洞察力!10位幸运用户将平分0.1 ETH 奖励!
详情 👉️ https://www.gate.com/post/status/12322403
3️⃣ #创作者活动第二期# |ZKWASM话题
在广场或推特发布与 ZKWASM 或其交易活动相关的原创内容,瓜分4,000枚ZKWASM!
详情 👉️ https://www.gate.com/post/status/12525794
4️⃣ #Gate广场征文活动第二期# |ERA话题
谈谈你对ERA的观点/体验,参与并推广活动,700 ERA大奖等你赢!
详情 👉️ https://www.gate.com/post/status/12361653
5️⃣ #MBG任务挑战# |MBG话题
分享你对MBG的洞察,积极参与和推广MBG活动,20位小 - 🎉Gate 2025 上半年社区盛典:内容达人评选投票火热进行中 🎉
🏆 谁将成为前十位 #Gate广场# 内容达人?
投票现已开启,选出你的心头好
🎁赢取 iPhone 16 Pro Max、限量周边等好礼!
📅投票截止:8 月 15 日 10:00(UTC+8)
立即投票: https://www.gate.com/activities/community-vote
活动详情: https://www.gate.com/announcements/article/45974
LINK的价格可能上涨57%?关于Chainlink前景的所有信息
Chainlink在加密货币开发领域表现出色,特别是最近在GitHub上的活跃度超过了以太坊。
这一点可以通过Chainlink在香港e-HKD+试点项目中的显著成功来解释,该项目的互动协议为CBDC和稳定币之间的跨境交换提供了机会。
Chainlink 超越以太坊 在发展竞争中
根据链分析公司Santiment的报告,Chainlink在过去30天的开发活动中超过了以太坊。这一成就巩固了Chainlink作为现实世界资产的代币化((RWA))顶级基础设施提供商的地位。
Santiment也透露,尽管Chainlink在GitHub上的活动排名第二,但在该平台上的贡献和开发水平上仍然超过排名第八的以太坊(。这反映了Chainlink的强劲韧性,尤其是在为组织实施使用案例方面。
“虽然大多数加密货币保持稳定,但 Chainlink )+7.7%( 和以太坊 )+6.3%(继续强劲增长。这两个项目都拥有强大的开发团队,在过去的 30 天里,Chainlink 举办了第二大最引人注目的 GitHub 活动,而以太坊排名第八,“Santiment 分析师表示。
与金融机构的紧密关系
Chainlink的技术进步发生在该网络正在与大型金融机构建立越来越强大关系的背景下。Chainlink的联合创始人Sergey Nazarov最近对Visa的报告进行了回应,确认Chainlink能够解决组织交易中智能合约的三个主要挑战:安全的数据源、跨链连接和合规标准。
纳扎罗夫告诉 X:
“我对Visa的报告感到非常兴奋,它表明Chainlink可以解决下一代智能合约在机构交易中面临的三个最大问题,所有这些都在一个平台上。”
公司还举了一个在香港金融管理局监管下,ANZ与Fidelity International之间复杂交易的例子,这进一步巩固了Chainlink为市场带来的独特价值。
6 月 9 日,Chainlink )CCIP(跨链互作性协议支持香港 CBDC 和澳元稳定币之间的安全交易。本次测试汇集了 Visa、ANZ、华夏基金和富达国际等众多主要金融公司,并引起了市场的积极反应,将 LINK 的价格从 13.9 美元推高至 14.6 美元,在公告发布后立即上涨了 8%。
这一增长反映了投资者对Chainlink作为企业区块链平台基础设施的信心日益增强。截止目前,LINK的价格在过去24小时内上涨了超过5%,交易价格为15.16 USD。
LINK的价格前景
尽管基本面因素支持Chainlink的增长趋势,但LINK的价格目前在16.04美元到17.43美元之间遇到强劲阻力,同时也是下降楔形模型的上趋势线。这些是该币种需要克服的重要障碍,以维持其增长势头。
如果 LINK 能够突破这些阻力位并保持在趋势线上方,那么从长远来看,价格可能会继续大幅上涨,并有可能反弹高达 57%。这个目标是通过测量楔形图案的高度并将其应用于潜在的突破点来确定的,为 LINK 创造了强大的动力。
当前的技术指标显示出积极的信号。具体来说,Chainlink 价格已成功逆转并在 50 天 SMA 获得支撑,目前为 15.07 美元。此外,100 美元的 14.35 天 SMA 也发挥着重要的支撑作用。
然而,对于想要保持LINK多头头寸的投资者来说,明确的信号是当价格收盘高于16.7美元时,因为这是供应区的重要水平。目前,RSI指标也支持上涨前景,因为它维持在50以上,表明买方占据主导地位,市场有可能继续保持积极趋势。
RSI超过50强调了上升趋势的强劲,同时显示了投资者的信心,因为LINK的价格在最近的交易中不断创出更高的水平。
![])http://img.gateio.im/social/moments-783574d65a256e94f210d0081a4c6b9e( LINK价格走势图1天 |来源:TradingView但是,如果楔形形态的上趋势线继续充当阻力位,Chainlink 价格可能会下跌,50 天 SMA 将返回阻力位。如果抛售压力增加,LINK 价格可能会突破支撑位,使 100 天 SMA 成为 14.35 美元的新阻力位。在这种情况下,10.78 美元至 11.46 美元之间的需求区域可能成为多头进入的机会,但如果该区域被突破,这些支撑位的失败可能会延长 LINK 持有者的损失。
随着基本面积极因素和稳定的技术,Chainlink 如果能在短期内突破关键阻力位,仍然有强劲的增长前景。
艾玛