Gate Research: ETH Struggles to Break Out, Trend Strategy Delivers 240% Return
Preface
This biweekly quantitative report (May 27 to June 9, 2025) focuses on the market performance of Bitcoin and Ethereum, offering a systematic analysis of key indicators such as long-short ratios, open interest, and funding rates to provide a data-driven interpretation of overall market conditions. The featured strategy module explores the practical application of the “Moving Average Trend Breakout Strategy” across the top ten crypto assets by market capitalization (excluding stablecoins), detailing its core logic, signal detection mechanism, and execution process. Through parameter optimization and historical backtesting, the strategy demonstrates strong stability and disciplined execution in both trend identification and risk management. Compared to a simple buy-and-hold approach for BTC and ETH, this strategy delivers superior performance in terms of return enhancement and drawdown control, offering a valuable reference framework for quantitative trading.
Summary
- Over the past two weeks, BTC traded within a relatively narrow range of 100,000 to 110,000 USDT with mild volatility. In contrast, ETH repeatedly tested the 2,600 USDT level but failed to break through, showing choppy price action and a lack of strong buying momentum, indicating cautious market sentiment.
- BTC open interest slightly declined from its peak, while ETH remained at relatively elevated levels, suggesting divergence in capital allocation between the two assets.
- In terms of funding rates, BTC experienced more pronounced fluctuations, frequently switching between positive and negative 0.01%, reflecting greater market uncertainty about its short-term direction.
- A sharp exchange between Elon Musk and Donald Trump on social media triggered brief market panic, with total liquidations across all platforms approaching $1 billion within 24 hours.
- In the quantitative strategy section, the “Moving Average Trend Breakout Strategy” was applied, and under optimal parameter settings, the XRP strategy achieved a return exceeding 240%.
Market Overview
To systematically present the capital behavior and structural changes in the cryptocurrency market, this report analyzes five key dimensions: the price volatility of Bitcoin and Ethereum, the Long/Short Ratio (LSR), open interest in futures contracts, funding rates, and liquidation data. These indicators collectively reflect price trends, market sentiment, and risk conditions, offering a comprehensive view of the current trading intensity and structural characteristics of the market. The following sections provide a detailed analysis of each indicator’s recent developments since May 27.
1. Price Volatility Analysis of Bitcoin and Ethereum
According to CoinGecko data, over the past two weeks, BTC has steadily fluctuated within the 100,000 to 110,000 USDT range, showing low volatility and a stable price structure—demonstrating strong downside resilience. In contrast, ETH repeatedly attempted to break above 2,600 USDT but quickly retreated, indicating weak follow-through momentum and a more hesitant market stance. Since late May, BTC has held above the 105,000 USDT level despite minor pullbacks, maintaining an upward structure with solid momentum. Meanwhile, ETH has struggled with a lack of volume support, facing selling pressure on rallies, with a noticeable MACD divergence suggesting intensified short-term tug-of-war between bulls and bears.
On May 28, the Federal Reserve released its FOMC meeting minutes, signaling a hawkish tone. Although it marked the third consecutive pause in rate hikes, officials expressed persistent concerns over sticky inflation, with core PCE at 2.6% and inflation not expected to ease until 2027. Additionally, the Fed lowered GDP growth forecasts and raised unemployment expectations, highlighting rising recession risks and dampening hopes for near-term rate cuts.
Overall, BTC appears to attract more capital and shows stronger resilience amid structural adjustments, while ETH lags due to weak narratives and limited momentum. Moving forward, attention should be paid to the upcoming June FOMC meeting, Bitcoin spot ETF inflows, and whether Ethereum’s Layer 2 ecosystem can reignite market interest.[1][2][3]
Figure 1: BTC fluctuates steadily between 100,000 and 110,000 USDT with mild volatility; in contrast, ETH shows weak breakout momentum and choppy price action, reflecting cautious investor sentiment.
In terms of volatility, ETH has exhibited significantly higher overall volatility compared to BTC, indicating that its price is more susceptible to short-term capital flows and market sentiment. ETH experienced sharp price swings on multiple trading days, particularly during localized rebounds and pullbacks, where volatility spiked rapidly—reflecting intense market speculation and frequent capital inflows and outflows.
In contrast, BTC’s volatility distribution has been more balanced, with no pronounced peaks, demonstrating stronger price stability and structural support. Amid a market lacking clear directional trends, BTC’s low-volatility profile suggests more stable capital allocation, while ETH—lacking sustained narrative drivers—has shown concentrated short-term volatility and greater sensitivity to news events.
Figure 2: ETH’s overall volatility is significantly higher than BTC’s, indicating it is more prone to short-term capital and sentiment-driven
2. Analysis of Long/Short Taker Size Ratio (LSR) for Bitcoin and Ethereum
The Long/Short Taker Size Ratio (LSR) is a key indicator that measures the volume of aggressive buying versus aggressive selling, often used to gauge market sentiment and trend strength. An LSR greater than 1 indicates that the volume of market buys (aggressive longs) exceeds that of market sells (aggressive shorts), suggesting a bullish market bias.
According to Coinglass data, the Long/Short Ratio (LSR) for both BTC and ETH has generally failed to resonate with recent price movements, indicating a lack of unified market expectations and reflecting a neutral sentiment with evident hedging behavior. For BTC, the price began pulling back from late May, falling from recent highs to around 102,000 USDT. Although there was a modest rebound after June 7, the overall structure remains corrective. During this period, the LSR did not decline significantly—instead, it briefly rose to 1.1 during the pullback, suggesting either short covering or tentative long positions being opened. However, this movement lacked sustained momentum, with the LSR continuing to fluctuate within the 0.9–1.1 range, highlighting the market’s indecisiveness and neutral outlook.
ETH saw a similar pattern. After retreating from the 2,600 USDT level in early June, the price consolidated near 2,400 USDT. The LSR for ETH was more volatile, frequently dropping below 0.9, reflecting persistent short-side pressure during price advances. Even during rebounds, the LSR failed to consistently hold above 1, signaling insufficient long-side conviction and intensifying market tug-of-war.
Overall, despite short-term technical rebounds in both BTC and ETH, the LSR has not exhibited a structurally bullish breakout, implying continued uncertainty regarding future direction. The recent LSR fluctuations are more likely due to short-term position adjustments or profit-taking by short sellers rather than a definitive trend reversal. Sustained LSR levels above 1 would be necessary to support a more prolonged upward movement in prices.[4]
Figure 3: BTC has been in a corrective phase since late May, with prices retreating to around 102,000 USDT. The LSR remains within the 0.9–1.1 range, suggesting a lack of clear directional consensus and a neutral market sentiment.
Figure 4: Even as ETH prices rebound, the LSR has failed to consistently hold above 1, indicating weak bullish conviction and intensified market tug-of-war.
3. Open Interest Analysis
According to Coinglass data, BTC and ETH futures open interest has shown diverging trends. BTC open interest peaked around $82 billion near May 20 and gradually declined, stabilizing between $72–74 billion over the past two weeks. This suggests that leveraged capital has been partially withdrawn amid price corrections, reflecting cooling market sentiment. In contrast, ETH open interest has remained relatively high since mid-to-late May, fluctuating around $35 billion. Despite notable price volatility, no significant deleveraging has occurred, indicating sustained participation and moderate-to-strong investor interest.
Overall, BTC’s leveraged positioning cooled notably following the late-May correction, whereas ETH demonstrated greater resilience in maintaining open interest. However, with ETH’s LSR staying low and price action choppy, market sentiment remains cautious, with activity leaning toward short-term speculation rather than structural trend formation. A synchronized resurgence in open interest across BTC and ETH would likely signal a renewed directional market move.[5]
Figure 5: BTC open interest retreats slightly from recent highs, while ETH remains elevated, reflecting diverging capital allocation strategies between the two assets.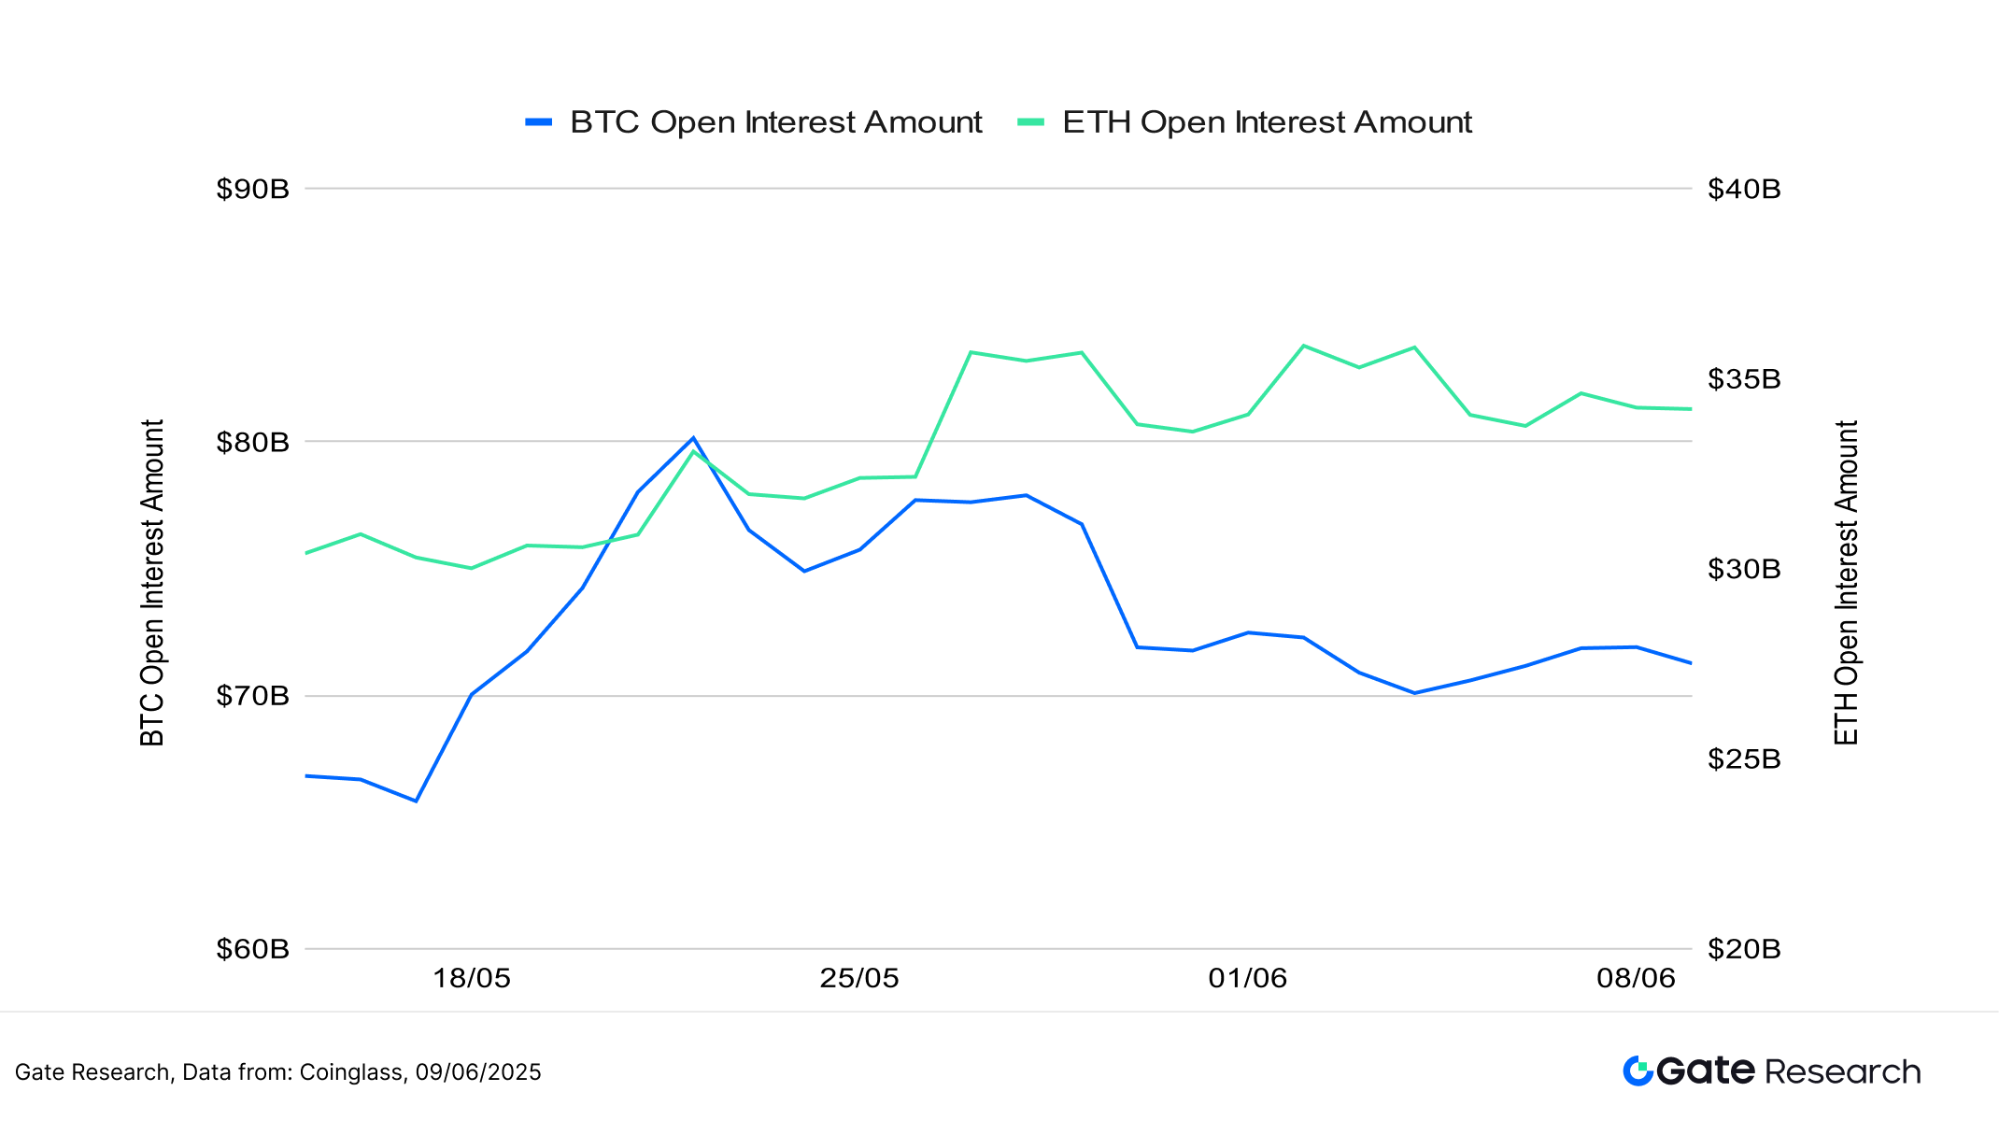
4. Funding Rate
BTC and ETH funding rates have fluctuated narrowly around 0%, frequently switching between positive and negative territory—reflecting a tug-of-war between long and short positions and a generally cautious market sentiment. Over the past week, BTC funding rates have been especially volatile, oscillating frequently within the ±0.01% range. This suggests heightened disagreement over short-term price direction and more aggressive entry and exit by leveraged capital, contributing to lower structural stability.
In contrast, ETH funding rates have also shown fluctuations but with a narrower range, indicating a more subdued and cautious approach by traders. Leverage deployment in ETH appears more restrained, and sentiment is comparatively conservative.
Overall, while both BTC and ETH saw instances of positive funding—implying short-term long interest—these did not evolve into sustained trends. The market continues to lack a clear directional bias, with position building remaining conservative. Funding rate behavior further underscores the neutral-to-cautious mood across participants.[6][7]
Figure 6: BTC funding rate exhibits more intense fluctuations, frequently switching within the ±0.01% range, reflecting heightened disagreement over short-term market direction.
5. Cryptocurrency Liquidation Chart
According to Coinglass data, long liquidations have consistently outpaced short liquidations on most trading days over the past two weeks, indicating a strong tendency among traders to chase upward momentum during BTC’s range-bound consolidation at higher levels. Capital inflows were predominantly directed toward long positions during price rallies.
However, during market pullbacks or heightened volatility, long positions were frequently liquidated, with total liquidation values surpassing $500 million multiple times. Notably, on June 5, long liquidations peaked at $875 million. That evening, a heated dispute between Elon Musk and Donald Trump on social media triggered short-term market panic. Tesla stock and Bitcoin prices dropped in tandem, amplifying market volatility. The incident led to a wave of forced liquidations across long positions, driving total liquidations close to $1 billion within 24 hours—marking one of the largest liquidation events in recent derivatives market activity.
In contrast, short liquidations remained relatively modest. Although some short squeezes occurred during brief price rebounds, they lacked sustained dominance. June 9 stood out as one of the rare days when short liquidations exceeded longs, driven by market optimism following positive signals from U.S.–China trade talks. The White House hinted at easing export restrictions, spurring a price rebound that forced the closure of aggressively positioned shorts.
Overall, the current liquidation structure is characterized by “long-dominated liquidations”, reflecting a tendency for market participants to misjudge short-term trends under conditions of high leverage and volatility. While trading activity remains elevated, data on LSR and funding rates suggest ongoing structural divergence and the absence of a clear directional trend. Caution is warranted, as liquidation spikes may continue to trigger sharp market swings and irrational drawdowns.[8]
Figure 7: Long positions frequently faced forced liquidations, with notional values exceeding $500 million multiple times—peaking at $875 million on June 5.
Quantitative Analysis – Moving Average Trend Breakout Strategy
(Disclaimer: All forecasts in this article are based on historical data and market trends and are for informational purposes only. They should not be considered investment advice or a guarantee of future market performance. Investors should carefully assess risks and make prudent decisions when engaging in related investments.)
1. Strategy Overview
The Moving Average Trend Breakout Strategy is a medium-to short-term trading approach based on the crossover of moving averages and price volatility to identify trend direction. By combining Simple Moving Averages (SMA) and Exponential Moving Averages (EMA), the strategy monitors directional shifts in price movement and uses the crossover of short-term and long-term moving averages as buy or sell signals. Additionally, it incorporates dynamic stop-loss and take-profit mechanisms to secure gains or limit losses. This strategy is well-suited for trend-following setups within choppy or range-bound market conditions.
2. Core Parameter Settings

3. Strategy Logic and Operational Mechanism
Entry Condition
- When there is no open position, the strategy triggers a buy order when the short-term moving average crosses above the long-term moving average.
Exit Conditions:
- Trend Reversal Exit: If the short-term moving average crosses below the long-term moving average, it signals a weakening trend and triggers an exit.
- Stop-Loss Exit: If the price falls to the entry price × (1 -
stop_loss_percent), a forced stop-loss is executed. - Take-Profit Exit: If the price rises to the entry price × (1 +
take_profit_percent), a take-profit exit is triggered.
Live Trade Example Chart
- Trade Signal Trigger
The chart below shows the most recent trade entry signal of the strategy on the XRP/USDT 4-hour candlestick chart dated June 3, 2025. After a brief pullback, a technical reversal occurred in the early hours of June 3: the short-term moving average (MA5) crossed above the mid-term moving average (MA10), the MACD fast and slow lines formed a bullish crossover, and trading volume expanded simultaneously—indicating strengthening bullish momentum. The strategy triggered a buy at this point, successfully capturing the subsequent price rebound, aligning with the entry logic of a trend-following long strategy.
Figure 8: Example of actual strategy entry point on XRP/USDT (June 3, 2025)
- Trading Action and Outcome
After a continuous upward move, XRP showed signs of short-term weakness. A bearish MACD crossover (death cross) formed, and the short-term moving average began to trend downward. The strategy executed a sell at this point, successfully locking in profits from the previous rebound. Although the price only experienced a slight decline afterward, this exit aligned with the risk management principle of “exit when momentum weakens” in trend-following strategies, demonstrating strong discipline in swing trading. Going forward, incorporating dynamic take-profit or trend-tracking mechanisms could further enhance overall holding efficiency and profit potential.
Figure 9: Strategy exit point on XRP/USDT (June 5, 2025)
Through the above real-world example, we intuitively demonstrated the entry and exit logic of a trend-following strategy, along with its dynamic risk control mechanisms during shifts in price momentum. The strategy identifies trend direction based on the crossover of short- and long-term moving averages—entering positions when the short-term average crosses above and capturing upward momentum; and exiting promptly when the short-term average crosses below or momentum indicators weaken, effectively mitigating drawdown risks. While controlling profit and loss fluctuations, the strategy successfully locked in key swing profits. This case not only validates the strategy’s practicality and execution discipline in live markets but also highlights its strong profit-holding and defensive capabilities in high-volatility environments. It provides a solid empirical foundation for further parameter optimization and cross-asset application.
4. Practical Backtesting Example
Backtest Parameter Settings
To identify the optimal parameter combinations, a systematic grid search was conducted within the following ranges:
short_period: 2 to 10 (step size: 1)long_period: 10 to 20 (step size: 1)stop_loss_percent: 1% to 2% (step size: 0.5%)take_profit_percent: 10% to 16% (step size: 5%)
Using the top 10 crypto assets by market capitalization (excluding stablecoins) as test cases, we backtested 4-hour candlestick data from May 2024 to June 2025. A total of 891 parameter sets were evaluated, from which the 10 best-performing strategies (based on annualized return) were selected. Evaluation metrics included annualized return, Sharpe ratio, maximum drawdown, and ROMAD (Return Over Maximum Drawdown), providing a comprehensive assessment of each strategy’s stability and risk-adjusted performance across different market conditions.
Figure 10: Comparison of the top 10 optimal strategy performance results.
Strategy Logic Description
When the system detects that the short-term moving average crosses above the long-term moving average, it interprets this as a trend initiation signal and immediately triggers a buy operation. This setup aims to capture the early phase of a market uptrend by identifying directional shifts through moving average crossovers, while incorporating dynamic take-profit and stop-loss mechanisms to manage risk. If the short-term moving average later crosses below the long-term one, or if the price reaches the predefined stop-loss or take-profit thresholds, the system automatically executes an exit to secure profits and limit losses.
Using XRP as an example, the strategy parameters are configured as follows:
short_period= 2 (short-term moving average period, used to track price movement)long_period= 19 (long-term moving average period, used to determine trend direction)stop_loss_percent= 1.5%take_profit_percent= 10%
This logic combines breakout trend signals with fixed-percentage risk controls, making it suitable for directional markets with clear swing structures. It effectively balances trend following with drawdown management, enhancing trading consistency and overall return quality.
Performance and Results Analysis
The backtest period spans from May 2024 to June 2025. Applying the trend-following strategy to the top 10 cryptocurrencies by market cap (excluding stablecoins) yielded consistently strong cumulative returns, with most assets significantly outperforming the BTC and ETH buy-and-hold strategies. Notably, XRP and DOGE delivered standout performances, achieving cumulative returns of 243% and 234%, respectively. In contrast, BTC and ETH spot holdings remained in prolonged consolidation or downward trends, with ETH experiencing a drawdown of over 50% at one point. The trend strategy effectively mitigated downside risk and captured multiple swing opportunities, demonstrating strong risk management and capital growth capabilities.
Overall, the trend-following strategy showed broad adaptability across various assets, maintaining drawdown control while steadily compounding returns even in volatile conditions. The current strategy configuration strikes a favorable balance between performance and stability, making it suitable for real-world deployment. Looking ahead, incorporating dynamic Bollinger parameters, volume-based factors, or volatility filters could further enhance performance across different market environments. Additionally, expanding the strategy to cover multi-asset and multi-timeframe frameworks could improve its adaptability and trading efficiency.
Figure 11: Cumulative return comparison over the past year between the top 10 optimal parameter strategies and BTC/ETH buy-and-hold strategies.
5. Strategy Summary
The Moving Average Trend Breakout Strategy employs moving average crossovers as its core entry and exit logic, combined with dynamic stop-loss and take-profit mechanisms. It has demonstrated robust risk management capabilities and solid return performance across multiple major crypto assets. During the backtest period, the strategy effectively captured several mid- to short-term trend opportunities and performed particularly well in ranging and reversal markets, significantly outperforming the traditional buy-and-hold approach.
From the multi-asset backtest results, strategies applied to assets such as XRP, DOGE, and ADA achieved outstanding outcomes, with maximum cumulative returns exceeding 240%, while also effectively avoiding deep drawdowns encountered by holding assets like ETH, thereby validating the strategy’s real-world applicability and resilience.
Notably, although the win rates for most strategy configurations were below 50%, positive overall returns were still achieved through a well-designed risk-reward ratio. This indicates strong effectiveness in profit-loss control and position management.
Overall, this strategy offers a well-balanced approach to drawdown control, return enhancement, and capital efficiency, making it suitable for deployment in highly volatile market environments. Future enhancements could include integrating technical factors such as Bollinger Bands, volume filters, or volatility screens to improve signal quality and performance across multiple timeframes and asset classes—laying a solid foundation for building a robust quantitative trading system.
Conclusion
From May 27 to June 9, 2025, the crypto market experienced a phase of heightened volatility and structural adjustment. BTC and ETH fluctuated between high-level consolidation and range-bound corrections, reflecting overall cautious market sentiment. Although open interest in derivatives remained elevated—indicating continued capital inflows—neither the Long/Short Ratio (LSR) nor funding rates showed a clear directional bias. This suggests that institutional capital remained focused on hedging and short-term trades, with elevated leverage and liquidation risks coexisting.
Notably, multiple long-side liquidation events occurred during this period. On June 5, a public clash between Elon Musk and Donald Trump on social media triggered panic, leading to a synchronized decline in Tesla and Bitcoin prices. Nearly $1 billion in positions were liquidated within 24 hours across the crypto market, underscoring investors’ fragile confidence at current price levels and the significantly heightened risks associated with leverage.
Against this backdrop, the current quantitative analysis focuses on the “Moving Average Trend Breakout Strategy”, evaluating its adaptability and practical effectiveness across different market conditions. The strategy identifies the initiation of a trend by detecting a short-term moving average crossing above a long-term moving average, while incorporating fixed-percentage stop-loss and take-profit mechanisms to manage risk. Backtest results showed outstanding performance in assets such as XRP, DOGE, and ADA, with peak cumulative returns exceeding 240% and effective drawdown control.
Importantly, although the strategy’s overall win rate was relatively low (below 50%), it consistently achieved positive long-term returns by leveraging a high risk-reward ratio and a disciplined exit mechanism. This reflects the strategy’s effectiveness in capital management and risk control. With a well-balanced profile in terms of profitability, robustness, and execution simplicity, the strategy shows potential for real-world deployment. However, in live trading, it may still be affected by market noise, extreme volatility, or signal failure. It is recommended to combine it with additional quantitative factors and risk management tools to enhance its stability and adaptability, while maintaining rational judgment and cautious execution.
References:
- CoinGecko, https://www.coingecko.com/
- Gate, https://www.gate.com/trade/BTC_USDT
- Gate, https://www.gate.com/trade/ETH_USDT
- Coinglass, https://www.coinglass.com/LongShortRatio
- Coinglass, https://www.coinglass.com/BitcoinOpenInterest?utm_source=chatgpt.com
- Gate, https://www.gate.com/futures_market_info/BTC_USD/capital_rate_history
- Gate, https://www.gate.com/futures/introduction/funding-rate-history?from=USDT-M&contract=ETH_USDT
- Coinglass, https://www.coinglass.com/pro/futures/Liquidations
Gate Research is a comprehensive blockchain and cryptocurrency research platform that provides readers with in-depth content, including technical analysis, trending insights, market reviews, industry research, trend forecasts, and macroeconomic policy analysis.
Disclaimer
Investing in the cryptocurrency market involves high risk. Users are advised to conduct independent research and fully understand the nature of the assets and products before making any investment decisions. Gate is not responsible for any losses or damages arising from such investment decisions.
Related articles

Gate Research: BTC Breaks $100K Milestone, November Crypto Trading Volume Exceeds $10 Trillion For First Time

Gate Research: 2024 Cryptocurrency Market Review and 2025 Trend Forecast

Gate Research-A Study on the Correlation Between Memecoin and Bitcoin Prices

Gate Research: Web3 Industry Funding Report - November 2024

Gate Research: October Crypto Market Review
